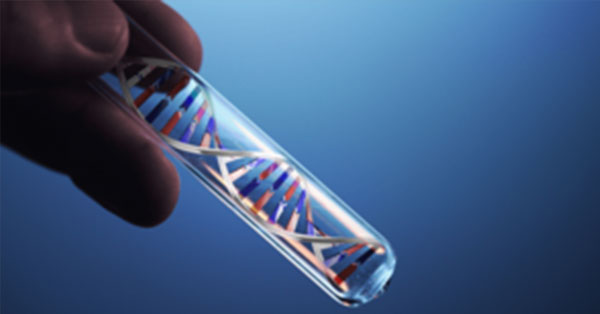
DNA Measurement - Photopette® Bio Comparison with Nanodrop and Shimadzu

P.Y. Yap and D. Trau, Tip Biosystems Pte Ltd, Singapore

– Photopette Bio provided quick DNA measurements directly within the cell culture hood or at the bench without sample transfer.

– Photopette Bio performs very well against Nanodrop and Shimadzu spectrophotometers.

Download PDF Version of this Application Note

In this application note we compare Photopette Bio versus other spectrophotometers namely Nanodrop and Shimadzu for direct DNA measurements at 260 nm. Our objective is to demonstrate the performance and pros can cons of the different instruments.


DNA (deoxyribonucleic acid) concentration measurement is a commonly performed procedure in life-science and biomedical research laboratories. A spectrophotometer can determine DNA/RNA concentration as well as its purity. Nucleic acids absorb ultraviolet (UV) light over a broad peak at around 260 nm; at 280 nm it only absorbs about half as much UV light compared to 260 nm [1]. DNA absorbs UV light due to heterocyclic rings of the nucleotides, its sugarphosphate backbone does not contribute to this absorption [2]. Typical spectrums of UV absorbance for different concentrations of purified DNA are presented in Figure 1.

The DNA concentration of an unknown sample can be determined at a wavelength of 260 nm using Beer-Lambert Law. The method does not require any other additional reagents or preparations, or the generation of a standard curve in advance. The absorbance of 1 AU correlates to a DNA concentration of 50 microgram per mL.

The wavelength of 340 nm is often used for a background correction in nucleic acid measurements. As seen in Figure 1, DNA and other nucleic acids do not absorb at 340 nm.

UV absorbance spectrums for different DA concentrations
Fig. 1: UV absorbance spectrums for different DNA concentrations.

Instruments:
Photopette® Bio (260, 280, 340 nm)
– Nanodrop benchtop spectrophotometer
– Shimadzu benchtop spectrophotometer

Reagents:
– Human DNA Quantitation Standard (NIST SRM372)
-Tris-EDTA buffer (Sigma Aldrich #93283)

Highlighted in this section are the steps followed to perform measurements for DNA standards with different spectrophotometers. We benchmarked the Photopette Bio against the Nanodrop and Shimadzu benchtop spectrophotometers.

EXPERIMENTAL PROCEDURE

DNA Standard: DNA solutions with a concentration from 0 to 52 microgram per mL were prepared by serial dilutions using TE buffer from a Human DNA Quantitation Standard (NIST SRM372). DNA concentration was calculated based on the information provided in NIST SRM certificate of analysis [3] and checked by using the Shimadzu spectrophotometer with quartz cuvettes.

Measurements: All measurements were performed with the same DNA dilutions. A linear regression was performed on the data using Microsoft’s Excel® software, and a linear fit was performed. The equation of standard curve along with its R-squared value was obtained.

Photopette Measurements

The Photopette is a fixed wavelength ultra-portable handheld spectrophotometer that weighs just 180 grams.

To start the measurement, turn on the Photopette® device and connect to the Photopette iOS/Android app. Select ‘ssDNA’ or ‘dsDNA’ as the measurement type, depending upon the sample type. In these measurements however, we selected 260 nm to obtain the raw data before calculation to DNA concentration. Select dataset and set additional settings (if needed) before selecting ‘Start Measurement’. Instructions about the novel Photopette device are available online at www.tipbiosystems.com. Please refer to the Photopette User Manual at the Tip Biosystems webpage for operating and safety precautions [4].

After performing the Autozero, the different DNA concentrations are measured using the same CuveTip. Measurements were performed with 3 different Photopette Bio devices. The dilutions are measured with five replicates for every concentration. The raw data is available in Table 1 in the Appendix – Raw Data.

STANDARD CURVE FOR PHOTOPETTE

A standard curve of Absorbance (AU) at 260 nm as a function of the DNA concentration (µg/mL) was plotted in Figure 3 below. All 3 devices performed well with an almost perfect overlap of the 3 calibration curves. The R-square values are all above 0.99 demonstrating very high linearity of the devices. The sensitivity of 0.017 was slightly lower than the other benchtop instruments. However, this lower value is compensated when the inbuild Measurement Types for the DNA or RNA measurements are being used.

Fig. 2: Photopette Bio used for direct measurements within the cell culture hood. The data is displayed on a smart device such as a tablet computer or smart phone.
Fig. 2: Calibration curves for 3 different Photopette devices.

LIMIT OF DETECTION

The Limit of Detection (LOD) for this assay using Photopette® is determined by factoring in the standard-deviation for blank measurements as well as experimental data using the equation given below [Using 3 x SD will result in a confidence of 99.86%.]:

LOD = 3 x SDblank / Slope(Standard Curve)

The Standard Deviation (SD) for the blank was determined in an additional experiment with 50 repeats using same CuveTipTM and was found to be 0.003 AU. The average sloop of the 3 devices is 0.0172. Thus, the limit of detection for the DNA measurement with Photopette using the equation above was 0.52 µg/mL.

LOD = 3 x (0.003 AU) / (0.0172 AU mL/µg) = 0.52 µg/mL

DYNAMIC RANGE

The Photopette has a large dynamic range with an AU of up to 3. Converted into DNA concentrations, the Photopette can measure from its LOD of 0.52 µg/mL up to about 150 µg/mL DNA without the need to dilute the sample.

NANODROP AND SHIMADZU MEASUREMENTS AND COMPARISON TO PHOTOPETTE

The Nanodrop [5] and the Shimadzu were used as provided in its manual both with a desktop PC for control. After performing the Autozero, the different DNA concentrations are measured using the same quartz Cuvette for the cuvette mode. The raw data is available in Table 2 and 3 in the Appendix – Raw Data.

STANDARD CURVE COMPARISON

The average of the 3 Photopette devices was calculated and plotted together with the data for the Nanodrop and the Shimadzu in Figure 4.

We did not perform accurate limit of detection methods for the Nanodrop and Shimadzu. It is very likely that the Shimadzu would have performed best with the lowest limit of detection.

It is hard to say if the Nanodrop would outperform the Photopette in LOD. We noticed a very high error at low DNA concentrations for the Nanodrop; this will lead to a high Standard Deviation (larger differences between measurements) for the blank and low concentration measurements and as a result into a poor LOD.

Calibration curves for Nanodrop in cuvette mode (yellow), Nanodrop in pedestal mode (red), Shimadzu (gray) and Photopette Bio (blue).
Fig. 4: Calibration curves for Nanodrop in cuvette mode (yellow), Nanodrop in pedestal mode (red), Shimadzu (gray) and Photopette Bio (blue).

The sensitivity of the Photopette was slightly lower than for the other devices. For users using the inbuild “Measurement Type” for the DNA or RNA this lower value is compensated by the inbuild calibration.

The Nanodrop had very large errors for small DNA concentrations of 300% and 500% and acceptable errors for high DNA concentrations.

The Shimadzu has very low errors for high concentrations and acceptable errors for low concentrations except the lowest concentration with also showed an error of 168%. In the interpretation of the data for the Shimadzu it must be considered that this was the instrument to determine the DNA concentrations in the standards. Therefore, it is very likely that this instrument performs best. If the Photopette would have been used as the reference instrument, then likely the Photopette would perform best in this test.

The Photopette had acceptable errors for almost all concentrations from low to high. The error was higher for low concentrations with a maximum of 65%.

It must be noted that the cost difference between the instruments is very large with about a factor of 1 : 3 : 10 for Photopette : Nanodrop : Shimadzu. Taking those differences into account the Photopette handheld spectrophotometer performed very well against benchtop instruments.

It shall also be noted that the time to perform the measurements was considerable shorter for the Photopette. This is due to the fact that no sample transfer into cuvettes is necessary. The measurement time was only about 25% compared to the other instruments. Also, the Photopette can be used at any lab bench and the often necessary relocation into the photometer room is not necessary.

All three instruments performed very well. Concentrations from 0 to 52 microgram DNA per milliliter were measured; this results only in an absorbance of about 1 AU. Therefore, the full dynamic range was not tested in these measurements.

The three different Photopette Bio devices performed excellent to each other; the calibration curves and sensitivity (slopes of the graphs) are almost identical. We could not test this for the Nanodrop and the Shimadzu instruments.

All devices performed well. The R-square values are all above 0.98 demonstrating very high linearity of the devices. The Nanodrop performed slightly lower.

[1]

Rothman R., “Determination of DNA Concentration and Purity by Ultraviolet Spectrophotometry.”

[2]

H. F. Lodish, Molecular cell biology. W.H. Freeman, 1999.

[3]

“Certificate of Analysis.” NIST Humanzied DNA Standard.

[4]

Tip Biosystems, F. Omar, “Photopette User Manual V1.0.0,” Singapore, 2017. “

[5]

Thermo Scientific NanoDrop Spectrophotometers Protein A280 Protein A280 Protein A280,” 2010.

Photopette and CuveTip are registered trademarks of Tip Biosystems Pte Ltd, Singapore. 


The raw data of all measurements is provided in this Appendix – Raw Data. All concentrations are in microgram DNA per milliliter (µg/mL). The actual concentration refers to the concentration that was measured with the different devices. Five measurements were performed for each DNA concentration and the average was calculated.

Photopette Bio: Three different devices were used for the measurements, designated as “PB” for Photopette Bio with model code 501 and device IDs #17-07, #17-09 and #17- 10. The data of the individual devices is provided bellow.

Photopette Bio measurement results

Absorbance values for prepared DNA standards measured with 3 different Photopette Bio devices.


Nanodrop: The Nanodrop model is a benchtop spectrophotometer. It was used for the measurements in cuvette and pedestal mode. The data for cuvette mode was obtained with quartz cuvettes.
 
NanoDrop measurement results

Absorbance values for prepared DNA standards measured in pedestal and cuvette mode with Nanodrop.


Shimadzu: The Shimadzu model is a high-end benchtop spectrophotometer. The data was obtained with quartz cuvettes and is provided bellow.


Absorbance values for prepared DNA standards measured a Shimadzu benchtop spectrophotometer.

Join Our Mailing List

SIGN UP TO RECEIVE UPDATES ON NEW PRODUCT ANNOUNCEMENTS, PROMOTIONS AND MORE.