Bradford Assay - Comparison Among Photopette®, Spectrophotometer and Microplate Reader
A performance comparison of different readout instruments for the Bradford Assay – among the Photopette®, a Shimadzu benchtop spectrophotometer and a BioTek microplate reader.
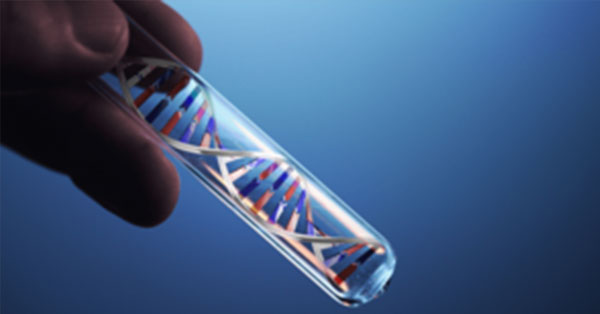
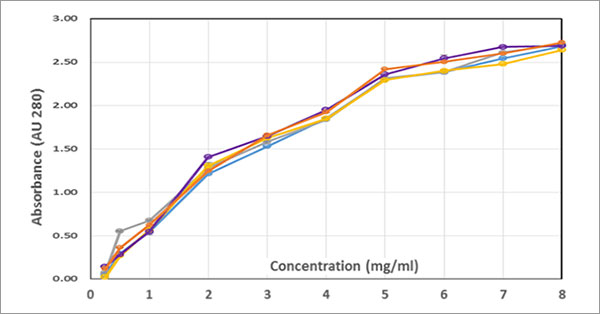
DNA Measurement - Photopette® Bio Comparison with Nanodrop and Shimadzu
In this application note we compare Photopette® Bio versus other spectrophotometers namely Nanodrop and Shimadzu for direct DNA measurements at 260 nm. Our objective is to demonstrate the performance and pros and cons of the different instruments.
Deoxyribonucleic acid is a molecule composed of two polynucleotide chains that coil around each other to form a double helix carrying genetic instructions for the development, functioning, growth and reproduction of all known organisms and many viruses. DNA and ribonucleic acid (RNA) are nucleic acids. Alongside proteins, lipids and complex carbohydrates (polysaccharides), nucleic acids are one of the four major types of macromolecules that are essential for all known forms of life.
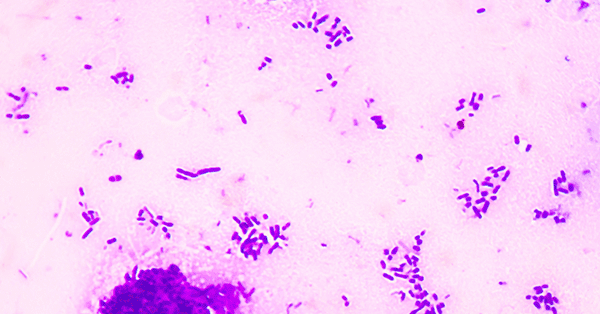
Escherichia coli, also known as E. coli, is a Gram-negative, facultative anaerobic, rod-shaped, coliform bacterium of the genus Escherichia that is commonly found in the lower intestine of warm-blooded organisms.
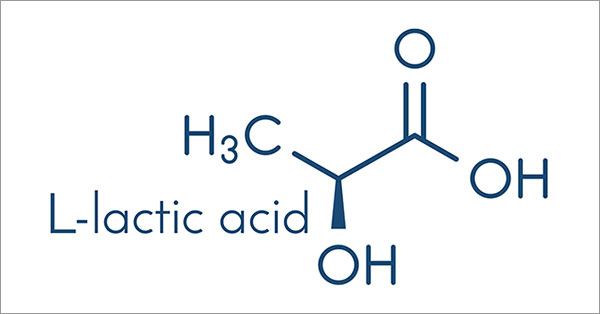
Determination of Lactate Concentration using Photopette® Cell
This application note provides an easy and fast enzymatic assay to quantify lactate in biological samples such as serum, plasma, urine, cell culture/fermentation media or in food & beverage products using Photopette®.
Protein Measurement Using Bradford Assay and Photopette® Cell
This application note demonstrates how the Photopette® OD600 and Photopette® Cell can be used for measurement of an unknown protein sample using a standard Bradford assay kit.
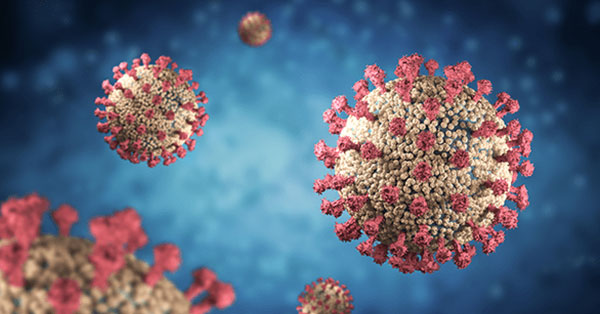
Photopette® for COVID19 related Cell Culture Research
Photopette® can be used within the cell culture hood to speed up COVID-19 related cell culture research. Determine cell densities, protein and DNA/RNA concentrations within seconds without any sample transfer and perform cell viability studies. Use of the Photopette® directly in the culture hood becomes very practical if working in biosafety regulated areas.
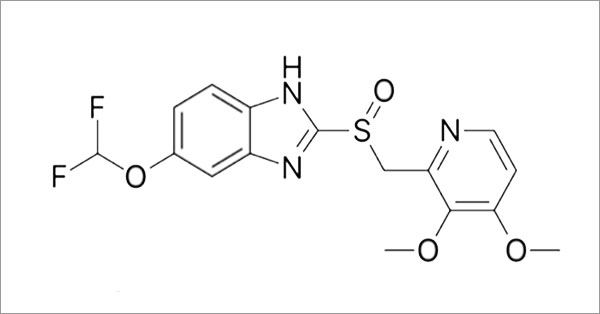
A method to measure the pantoprazole content in tablets within 10 minutes. There are no reagents necessary. The method is easy and fast performed in two steps 1) Calibration and 2) Measurement. The method can be performed at any location and does not require a lab.
Yeast cell counting at OD600. Almost no training is required. The method is easy and fast performed at the brewery or in the cell culture hood. Yeast can be directly measured at 600 nm in the cell culture flask. The method can be performed at any location and does not require a lab.